Dallas, Texas, USA
0
Follow on

TRACE

Threat Response & Activity Chronology Engine

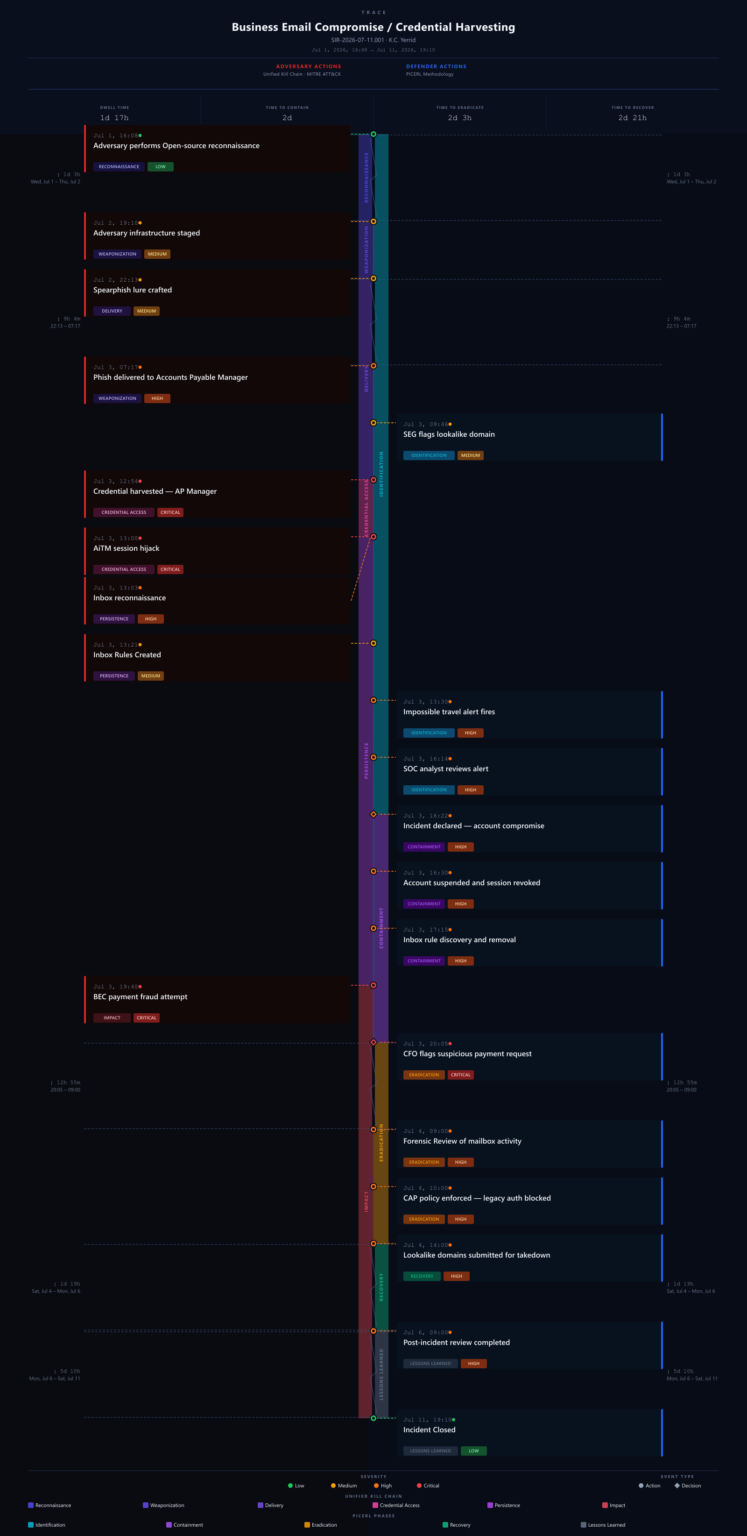
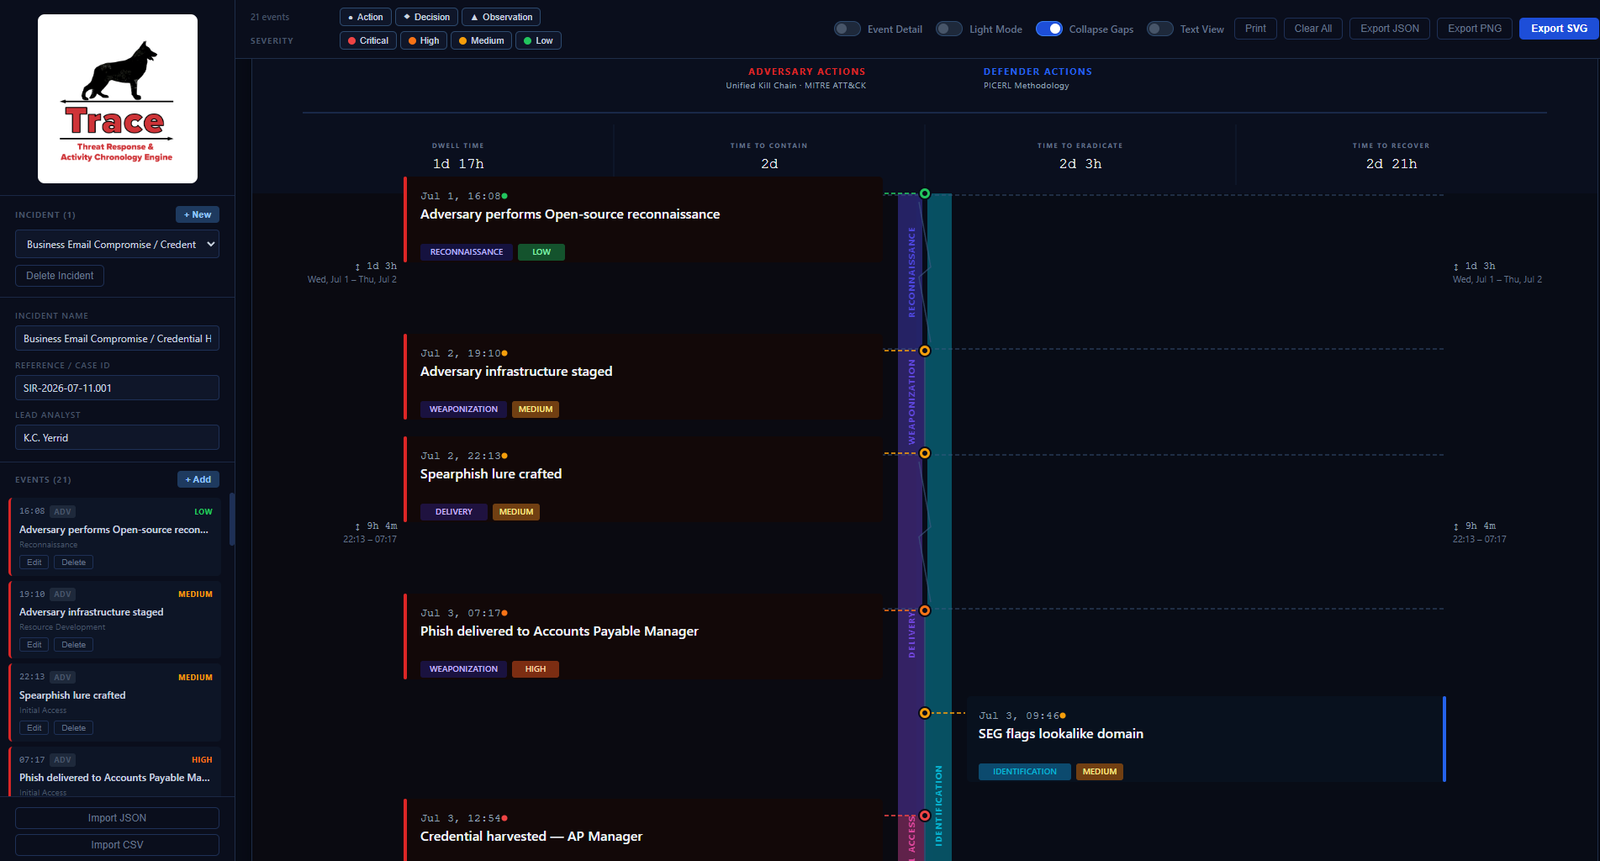
Every breach has two stories — the adversary's moves and the defender's response. TRACE builds both timelines simultaneously, binding each event to its kill chain phase, ATT&CK tactic, PICERL stage, and IOCs — so the full operational picture emerges, not just the logs.
HOW IT WORKS
Image link
2
PARALLEL TIMELINES
18
UKC PHASES MAPPED
7
PICERL STAGES
EVENT DEPTH
THE INSTRUMENT

A dual-perspective timeline engine that makes the gap between attack and response visible.

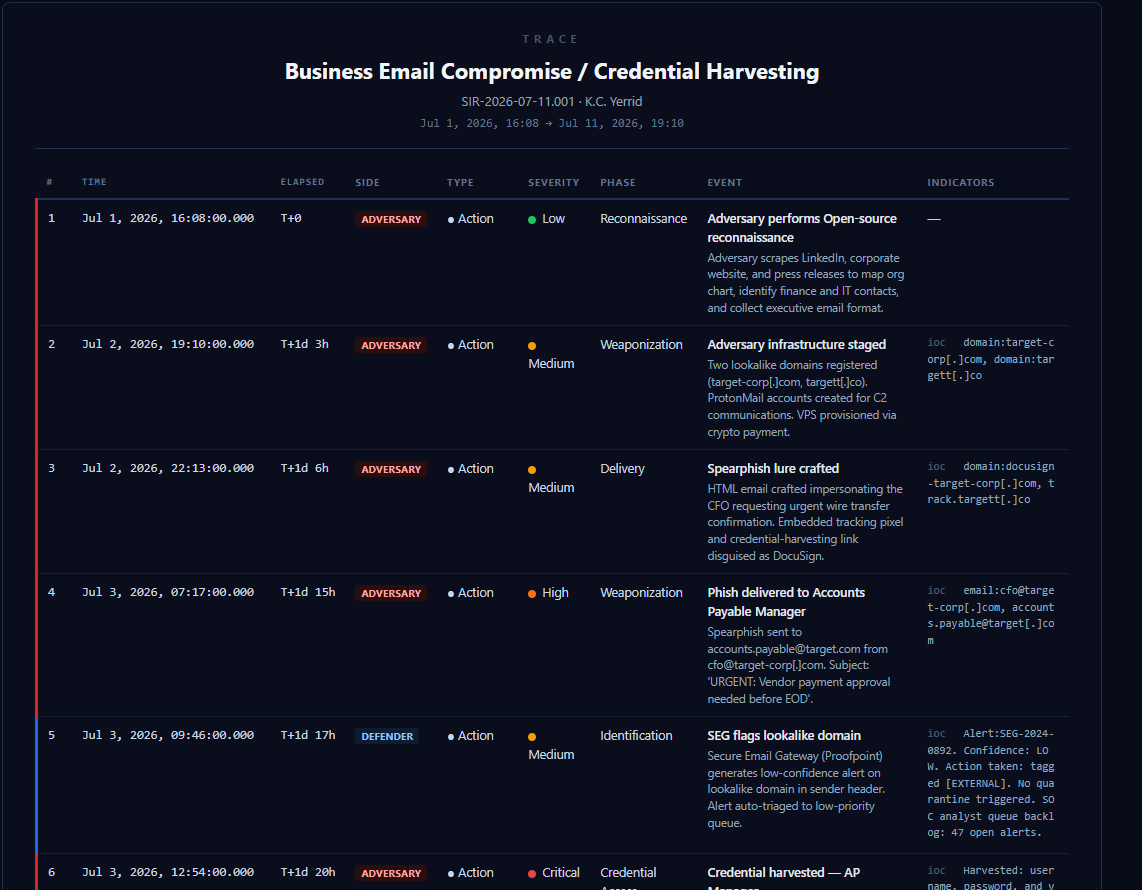
TRACE does one job. It captures incident events from both the adversary's operational timeline and the defender's response track in parallel — binding each event to a structured framework layer, severity rating, and IOC set — so post-incident reviews, threat hunt reconstructions, and regulatory reporting all pull from a single authoritative record.

FORM FACTOR

Browser-based timeline builder. No install, no client software. The Timeline Lead drives the session; contributors log events from anywhere.

TIMELINE MODEL

Dual-track chronology with parallel adversary and defender event streams. Events are timestamped to UTC and linked across tracks by reference ID — so detection lag and dwell time are calculated automatically from the record.

INPUTS

An incident — active, closed, or simulated. Optional import from SIEM exports, ticket systems, or DICE session logs. Manual entry supported for every field.

OUTPUTS

A complete incident timeline with every event captured, every framework tag applied, every IOC recorded. Exportable as a PDF chronology report, JSON evidence package, CSV event log, or a regulatory submission artifact mapped to NYDFS Part 500, GLBA/Reg S-P, or PCI DSS incident reporting requirements.
FRAMEWORK COVERAGE

Unified Kill Chain (18 phases) for adversary track mapping. MITRE ATT&CK tactics and technique IDs at the event level. PICERL (Prepare → Identify → Contain → Eradicate → Recover → Lessons Learned) for defender track mapping.

SEVERITY SCALE

Critical / High / Medium / Low — applied per event, not per incident.

INTEGRATIONS

DICE session log import for tabletop after-action reconstruction. Planned: TheHive case export, Splunk/LogScale query-to-event bridge, and SCOUT threat actor annotation.

THREE PILLARS OF PLAY

Scenarios, roles, and dice. The same three legs every tabletop has stood on for fifty years — pointed at your runbook.

A DICE session has three moving parts. The scenario sets the adversary, the kill chain, and the constraints. The roles assign who at the table can do what. The dice mechanics decide whether the action lands, partially lands, or fumbles into the next problem.

Image link

PIL. 01

The Event

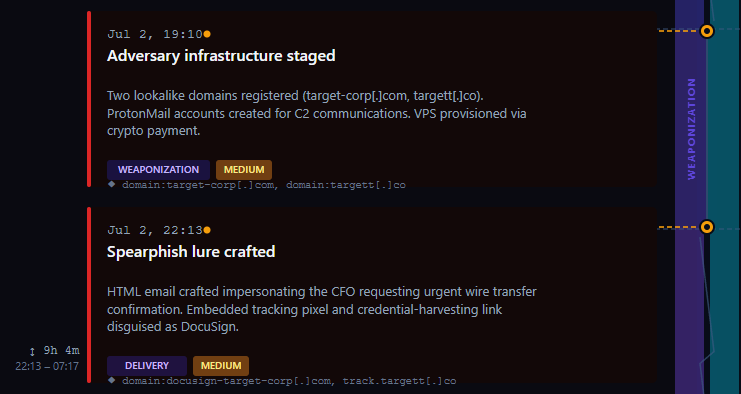
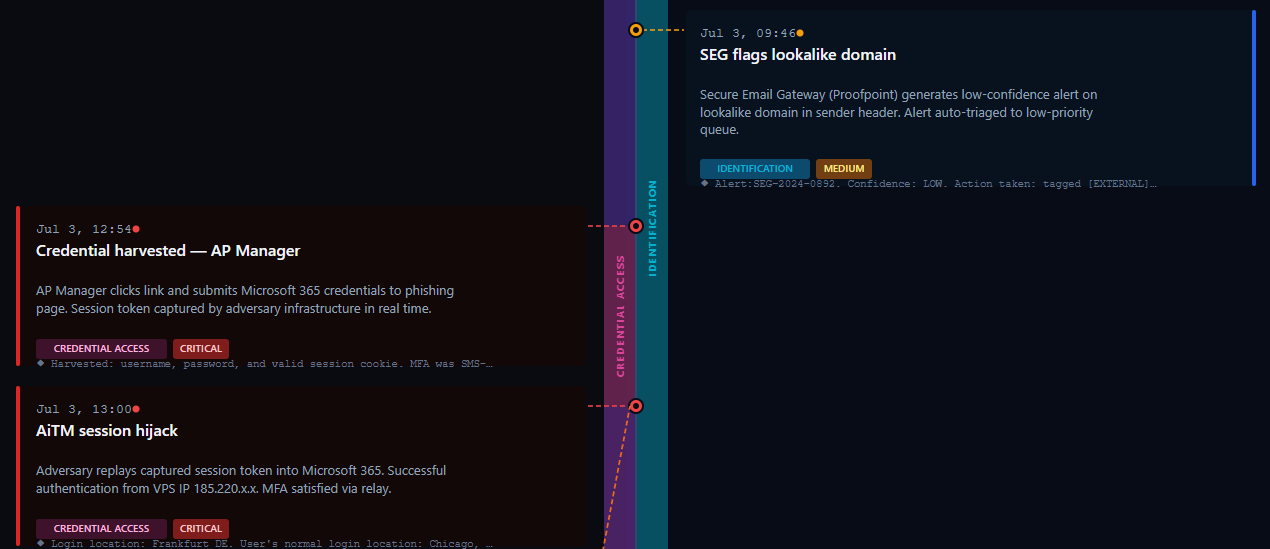
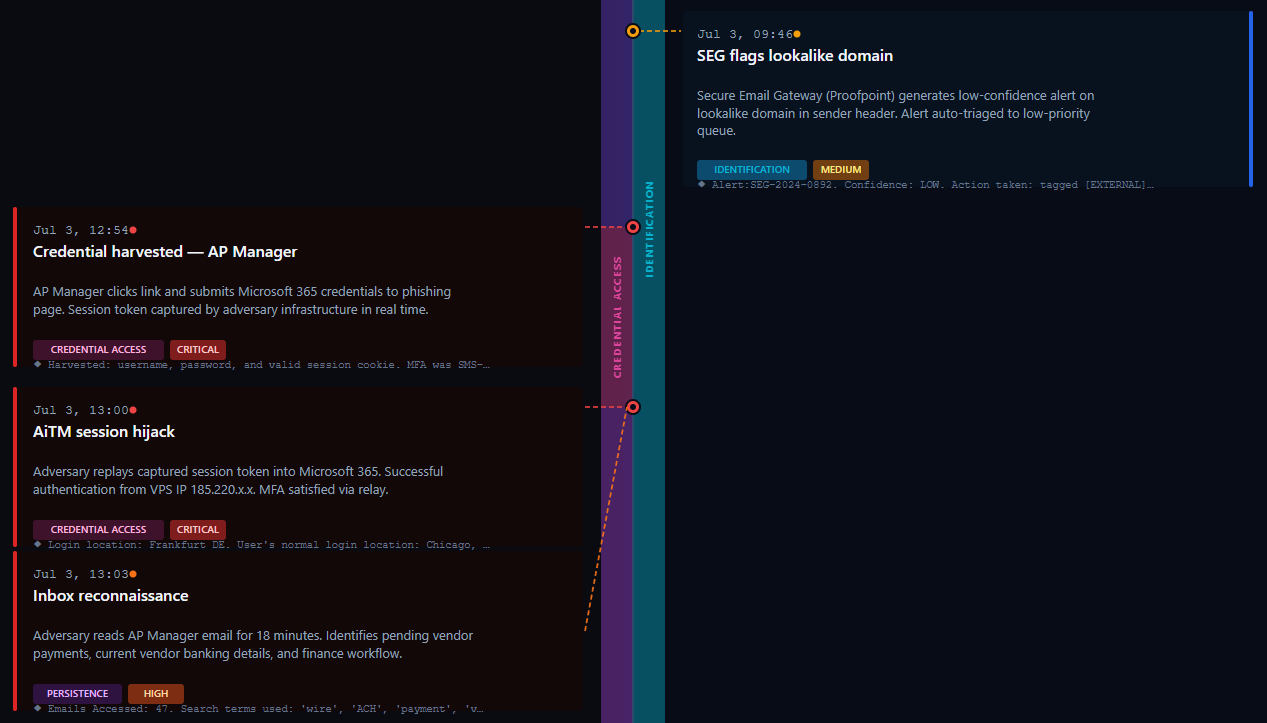
Every timeline entry starts with a structured event record — a title, timestamp, description, severity, and at least one IOC. From there, the event is classified as an action, a decision, or an observation, and assigned to either the adversary or defender track. That classification is what makes the record queryable — not just readable.


CORE FIELDStitle · timestamp · severity · iocs
EVENT TYPESAction / Decision / Observation
TRACKSAdversary · Defender
Image link

PIL. 02

The Framework Layer

Each event carries its Unified Kill Chain phase and MITRE ATT&CK tactic and technique ID on the adversary track, and its PICERL stage on the defender track. The framework layer isn’t a tag you add at the end of the investigation — it’s a field you fill at the moment you log the event, while context is still present.


ADVERSARY FRAMEWORKSUKC · ATT&CK
DEFENDER FRAMEWORKPICERL
UKC PHASES18
Image link

PIL. 03

The Chronology

TRACE holds both tracks against the same clock. Every adversary event and every defender response carries a UTC timestamp, and the engine calculates dwell time and detection lag directly from the record. Cross-track links connect the attack event that triggered a response to the response itself — so the gap is a measured value, not an after-the-fact estimate.


TIMESTAMP PRECISIONUTC · millisecond
CALCULATED METRICSDwell Time · Detection Lag
CROSS-TRACK LINKSlinked_eventid per entry
THE RECORD ENGINE

Ten fields. Every event that ever mattered in an IR captured as a record that can actually be queried.

TRACE encodes the common things an analyst logs during an incident — detections, containment actions, escalation decisions, IOC observations — as structured field entries against a defined schema. Every field has a purpose.

Timestamp

UTC · ms precision → dwell time calculated from this

Title

string → one-line summary of the event

Detail / Evidence Notes

string → detailed summary of the event

Severity

critical · high · medium · low

Side

adversary · defender

Event Type

Action / Decision / Observation

Framework Tags

UKC phase · ATT&CK T#### or PICERL stage

Host / System

one or more hosts involved with the event · comma-separated

Evidence URL

link to the evidence of the event middot; screenshots, log files, .msg files

IOC / Indicators

ip · hash · domain · email · url → array, searchable

AFTER-ACTION REPORTING

Every timeline ends with a report. The record is the evidence. You can read every event that produced it.

The TRACE report isn't generated from a template — it's derived directly from the event record you built. Every metric it surfaces — dwell time, detection lag, containment window, IOC count, framework coverage — is a calculated value from timestamped, field-validated entries. Regulators don't want your narrative. They want a timeline with sources. TRACE produces both from the same record.

Image link
END TO END

Setup, play, debrief, archive. One platform, four stages, no spreadsheets.

Most tabletop exercises end with a verbal "we should fix that" and a Word doc nobody opens. DICE collapses the cycle into a single platform that captures the encounter, scores it, and pipes the action items straight into the systems your team actually uses.

STAGE 01

Open

Create a timeline. Name the incident, set the scope, assign a Timeline Lead. Contributors join from any browser. The record is live the moment the first event is logged — not after a retrospective meeting.

STAGE 02

Log

Enter events as they surface — or reconstruct them from existing artifacts. Each entry captures title, timestamp, type, severity, and IOCs. Framework tags are applied at log time, while context is still present. Everything is timestamped to UTC.

STAGE 03

Tag

Bind each adversary event to its UKC phase and ATT&CK technique. Bind each defender event to its PICERL stage. Link response events back to the adversary events that triggered them. Dwell time and detection lag are calculated automatically from those links.

STAGE 04

Export

The timeline exports as a PDF chronology report, a JSON evidence package, a CSV event log, or a regulatory submission artifact. Every metric in the report traces back to a specific timestamped event. The record is the evidence.